After adding an infographics entity to the current family, you can design it by performing the following actions:
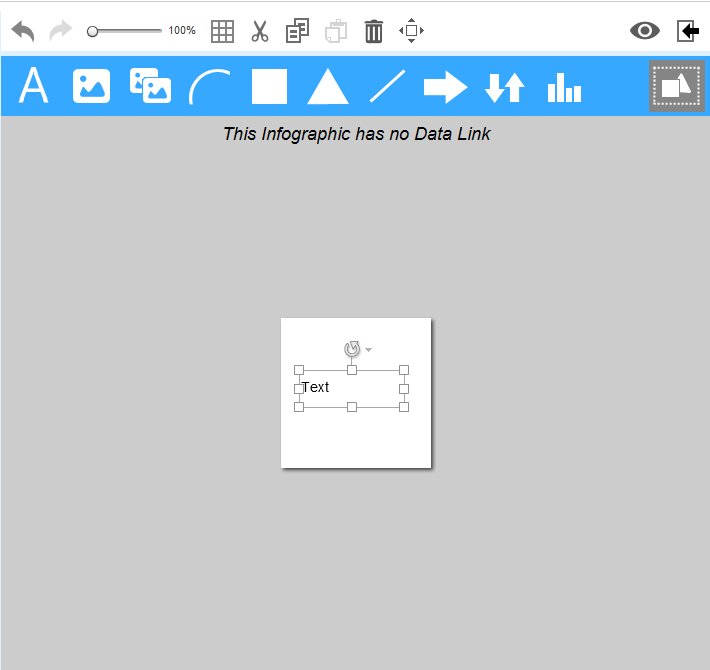
In the design area, click the icon of a graphic object on the Graphics toolbar. Then, click on the canvas, at the point where you want to position the item.
In the following example, a text object has been placed on the canvas.
Use the handles of the graphics to resize and rotate the object. Click and drag the graphics to reposition it on the canvas.
Use the buttons on the Actions toolbar to further edit your canvas.
Add more graphics, positioning and sizing them to suit your design.
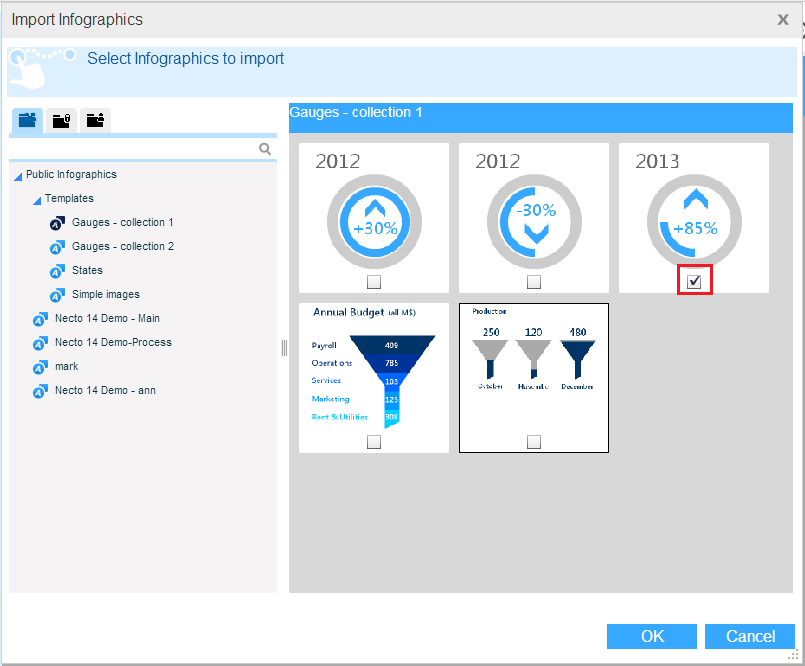
You can import graphics from another infographics family and then edit the design to suit your needs.
Click the Import Infographics ![]() button. In the Import Infographics dialog box, select the family you want, and then select the entity to import. Click OK.
button. In the Import Infographics dialog box, select the family you want, and then select the entity to import. Click OK.
The Preview option is used to see how the infographics entity will look in an infographics component in a workboard, with connection to live data. Use this option at any stage while designing the entity, in order to see how your definitions apply to the infographics.
Click the Preview ![]() button.
button.

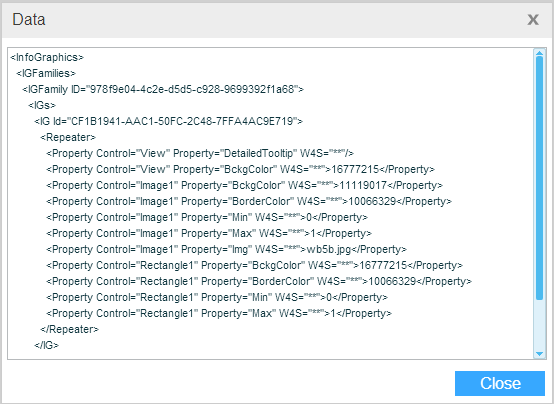
To view the XML code behind the infographics, click the Data button.